Reflections on Robens – fifty years after
What difference did Robens make? Analysing health and safety data across the decades
Alan Spence, former HSE Chief Statistician
April 2022
This paper was completed in April 2022. Sadly, shortly after it was finished, the author Alan Spence died. Alan put in significant effort and brought huge enthusiasm to this work and the detail in the final text attests to his expertise and insight.
Contents
- Executive Summary
- 1 Background
- 1.1 The 50th Anniversaries Project
- 1.2 Statistics quoted by Robens
- 1.3 Development of GB health and safety statistics since Robens
- 1.4 Questions to be addressed by this analysis
- 2 What has happened to health and safety outcomes in Great Britain in the past 50 years?
- 2.1 Which health and safety outcomes to cover
- 2.2 Published National Statistics
- 2.3 Statistical assessment of change over time in each outcome
- 2.4 Comparison with a counterfactual
- 3 How does this compare with other countries’ experience?
- 3.1 Data availability and comparability
- 3.2 International comparisons of levels
- 3.3 International comparisons of changes over time
- 4 How much of the changes can be attributed to broader economic and social factors?
- 4.1 Industrial/occupational structure
- 4.2 The economic cycle
- 4.3 Broader social conditions and policies
- 5 What can be said about the impact of Robens/HSW/HSE?
- 5.1 Approach to overall judgement
- 5.2 Safety outcomes
- 5.3 Health outcomes
- 5.4 Health and safety outcomes
- 6 Remaining questions
- 6.1 Data on the management of health and safety
- 6.2 Case studies of outcomes in specific contexts
- 6.3 Analysis of the costs and benefits of the post-Robens regime
- 6.4 Extension of the analysis to cover the regime for Major Hazards
- 6.5 Statistical basis for future analysis of the impact of the health and safety regime
- Annex: Sources for international data
- Footnotes
Executive Summary
The Robens Report included statistics, and recommendations about statistics …
The 1972 Robens Report began by presenting the limited statistics on health and safety outcomes available at the time. These showed fatal injuries falling during the preceding decade (and comparing favourably with other countries), with a more mixed picture for non-fatal injuries and working days lost; no data were presented for ill health. Recognising criticisms of the official statistics, the Report recommended devising a “standard form of accident report” and creating a “small but professional statistical unit”.
… which have helped guide the developments made by HSE over subsequent decades.
The standard report form enabled the development of RIDDOR injury reporting, which has remained the key source for fatalities, although under-reporting and discontinuities limit its use for non-fatal injuries. HSE has developed a variety of sources for ill health, and has used the Labour Force Survey (LFS) to give the most comprehensive picture for both ill health and injuries. An “Economics and Statistics Unit” was created early in the life of HSE, separate from the “Medical Statistics and Surveys Unit” (the units only merged in the mid-2000s).
Changes in health and safety outcomes can be assessed using a range of indicators from published National Statistics …
Seven indicators have been identified to cover a range of health and safety outcomes, each expressed as a rate (e.g. per 100,000 workers) and based on published “National Statistics” (which meet independent quality standards): workplace injuries, fatal and non-fatal; work-related ill health, overall and for three sub-categories; and working days lost. Different periods’ data are available for different indicators (e.g. since 1974 for fatal injuries but only since 2001/02 for working days lost), and a key metric is the annual average percentage change (using 3-year averages to avoid distortion by a single year’s data).
… most of which have seen substantial improvements over time.
Six of the seven indicators of health and safety outcomes in Great Britain have shown annual falls, ranging from 4-5% per year for non-fatal and fatal injuries, to 2-3% per year for musculoskeletal disorders (MSDs) and breathing/lung problems, and 1-2% per year for working days lost and total work-related ill health. The rate of work-related stress, on the other hand, showed an annual rise of 3% per year.
These average annual percentage changes are calculated up to 2019/20, starting from the earliest data available (which varies for different outcomes). The data show that since 2010 the rate of improvement has decreased substantially. Indeed, the average annual percentage falls up to 2009/10 were higher than those calculated over the whole period up to 2019/20, for all the outcomes where there has been an improvement. This difference was especially pronounced for work-related ill health, breathing and lung problems and working days lost, where the average annual decreases were between 1.1 and 4.9 percentage points higher up to 2009/10 than up to 2019/20. The difference for fatal and non-fatal injuries and MSDs, meanwhile, was between 0.1 and 0.4 percentage points.For work-related stress, depression or anxiety – the one indicator that showed an increase up to 2019/20 – the average annual increase was lower by 0.6 percentage points in the period up to 2009/10 than over the whole period.
These need to be compared with a ‘counterfactual’ of what might have happened in the absence of the post-Robens GB regime, comparing either with pre-Robens data …
The very limited data on trends in health and safety outcomes prior to Robens suggest that the post-1974 rates of improvement are higher than in the preceding period, for non-fatal injuries, working days lost and to a lesser extent fatal injuries.
… or with the experience of other comparable countries, which generally show GB performing better when looking at both levels and changes over time.
International comparisons are constrained by the availability of comparable data. The latest broadly comparable statistics on levels of health and safety outcomes show the UK performing better than most EU countries for fatal injuries and work-related ill health, and to a lesser extent non-fatal injuries. Comparing changes over time for the limited number of large, industrialised countries for which a consistent time series is available, the GB rate of improvement is similar to most of them for fatal injuries, and somewhat faster than most for non-fatal injuries.
For safety outcomes, there is evidence of the impact of changing industrial structure …
Previous HSE-sponsored research has shown that a good part of the fall in the rate of non-fatal injury has been due to the changing occupational structure of the GB workforce, towards lower-risk service jobs. Further analysis shows that in terms of industrial shifts in employment, the period studied in that research was broadly representative of the longer period of interest here, and so its findings can be expected to apply here too.
… but this does not invalidate the international counterfactual comparisons.
The international data are again limited, but in terms of very broad industrial structure the large shifts observed in GB have been fairly typical of the other large industrialised countries analysed. In other words, to the extent that such shifts explain some of the improvements in injury rates in GB, this can be expected to apply to other countries too, so the favourable international comparisons above cannot just be put down to structural shifts in the GB economy. (For most health outcomes, in contrast, the growth in the service sector is likely to have meant a move to higher-risk employment and hence higher rates).
There is also some evidence of the importance of broader social conditions and policies, especially for health outcomes.
There is a wide range of potential broader influences on occupational health and safety outcomes, beyond those attributable to the regulatory regime introduced by Robens. These include changes in the prevalence of non-work causes of some health conditions (e.g. MSDs), in awareness of and attitudes to reporting (e.g. stress), and in policies in areas other than occupational health and safety (e.g. public spending). The potential importance of such shorter-term factors is illustrated by the fact that five of the seven indicators showed a slowing in the rate of improvement around 2010 (or in one case 2015).
The overall judgement is that the regime brought in by Robens has contributed to the substantial improvements seen in workplace safety outcomes …
The judgement is based on the weight of evidence, using expert assessment as well as quantitative data. The annual average rates of improvement in non-fatal injuries are higher than those seen in the decade immediately prior to Robens, and in other major industrialised countries; while Britain’s fatal injury rate, standardised for industrial structure, is around half the EU average. The evidence suggests that structural changes in the economy (towards the service sector) played a part in these improvements; however similar changes were happening in other major economies.
… while it is not possible to arrive at an overall judgement on the impact of Robens on work-related ill health or working days lost.
For health outcomes, no comparisons are available with the pre-Robens period, or with changes over time in other countries, but the GB rate of work-related ill health from the EU-wide LFS is around half the EU average. Because of the limited scope for comparisons with a counterfactual, and relatively short time series, it is not possible to arrive at an overall judgement on the impact of Robens. For working days lost, the annual average rate of improvement appears to be higher than in the immediate pre-Robens period, but no international comparisons are available, and again no overall judgement is possible.
Finally, a number of questions remain to be addressed.
A number of questions have arisen which could not be answered here but which it may be possible to consider at later stages of the overall Project. These include the potential for analysing data on the management of health and safety, including from international sources; and conducting case studies of outcomes in specific contexts, for example the construction sector.
The following table summarises the key data and supporting evidence for each of the seven indicators of health and safety outcomes. All percentage changes are calculated using three-year averages at the beginning and end of the period concerned; detailed sources and definitions are given in the body of the paper.
|
Overall % change (and period) |
Annual average % change |
Comparison with counterfactual |
Potential impact of economic and social factors |
||
|---|---|---|---|---|---|---|
Pre-Robens |
Other countries: levels |
Other countries: changes |
||||
Fatal workplace injuries |
-88% (1974-2019/20) |
-4.8% |
-3.5% annual average change |
Half of EU28 average (0.61 c.f. 1.17 per 100,000) |
Similar to most other major countries (e.g. France -4.4%) |
Improvement partly reflects structural economic change (towards the service sector) but probably no more than in other major countries. |
Non-fatal workplace injuries |
-72% (1986/87-2019/20) |
-4.0% |
+1.2% annual average change |
Below most major EU states (1.4% c.f. 3.1% France, 1.8% Italy, 1.8% Spain and 0.7% Poland) |
Faster than most other major countries (e.g. France -2.4%) |
|
Work-related ill health |
-28% (1990/91-2019/20) |
-1.2% |
|
Half of EU28 average (1.9% c.f. 3.7%) |
|
Worsened by structural economic change. May also reflect increasing levels of awareness and reporting, especially of work-related stress, as well as a role for wider socio-political factors. |
Musculoskeletal disorders (MSDs) |
-50% (1990/91-2019/20) |
-2.6% |
|
|
|
|
Stress, depression or anxiety |
+131% (1990/91-2019/20) |
+3.2% |
|
|
|
|
Breathing or lung problems |
-28% (2001/02-2019/20) |
-2.1% |
|
|
|
Improvement may partly reflect structural economic change. |
Working days lost |
-27% (2001/02-2019/20 |
-1.9% |
+2.3% annual average change |
|
|
Most days lost are from ill health, so similar points apply as above. |
Key
Improvement /
better than counterfactualNo change /
similar to counterfactualDeterioration /
worse than counterfactual
1 Background
1.1 The 50th Anniversaries Project
1.1.1 This analysis forms part of a broader piece of work to mark the 50th anniversaries of the publication of the Robens Report in 1972, the passing of the Health and Safety at Work Act (HSWA) in 1974 and the creation of the Health and Safety Executive (HSE) the following year. Its aim is to provide solid analytical foundations for the remainder of the work: what has happened to occupational health and safety outcomes in Great Britain in the past 50 years; how does this compare with other countries’ experience; how much of the changes can be attributed to broader economic and social factors; and so what, overall, can we say about the impact on health and safety outcomes of Robens/HSWA/HSE?
1.1.2 The analysis takes as its starting point the published statistics on workplace injuries and work-related ill health which have been collated by HSE over the last 50 years, together with information on other countries’ experience and on broader economic and social developments. It draws on the views and experience of government statisticians and other analysts who have worked in HSE over the years[1].
1.2 Statistics quoted by Robens
1.2.1 As pointed out in David Ashton’s essay Why Robens?[2], the 1972 Report began by quoting the available statistics: around 1,000 people killed at their work each year in Great Britain, half a million suffering injuries, and 23 million working days lost annually through industrial injury and disease. However, beyond listing these big numbers – and stating that “the orders of magnitude are plain enough” and “the rough figures … speak for themselves” (paragraph 11) – there is virtually no real analysis of the data.
1.2.2 This partly reflects problems with the official statistics at the time, as described in a later chapter of the Report: they were (to paraphrase) cobbled together from operational data collected by a number of different inspectorates, were subject to high and varying levels of under-reporting and were distorted by factors such as changes in attitudes to sickness absence. Moreover, reliable international comparisons were not possible, because of differences in methods of collation and presentation, as well as differences in industrial structure (at that time no attempt was made to adjust for these).
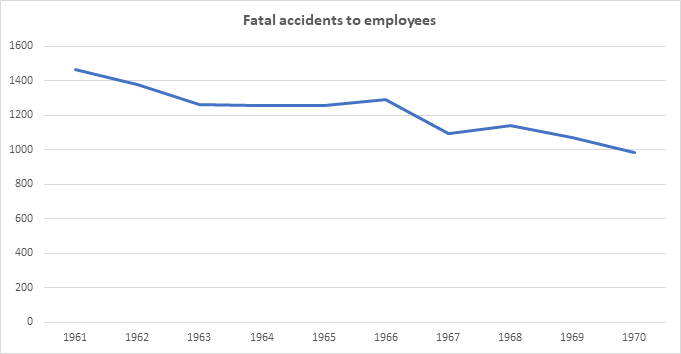
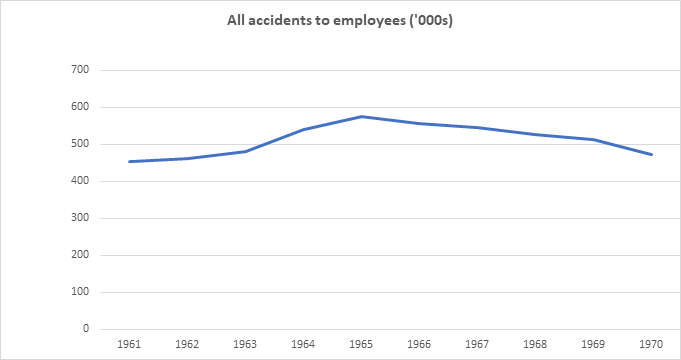
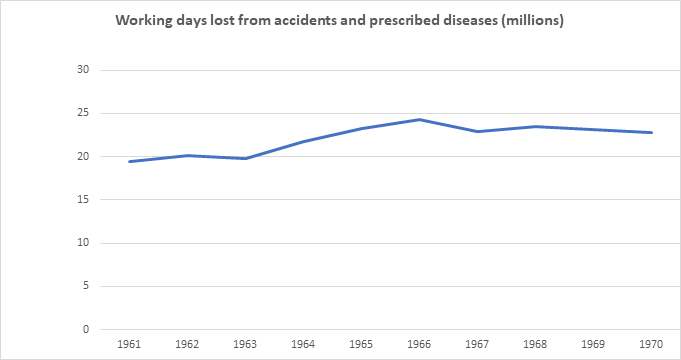
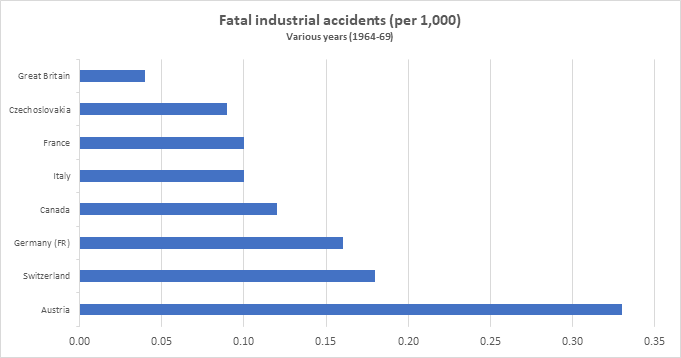
1.2.3 The data are presented in more detail in four tables towards the end of the Report[3], for the ten years up to 1970. Briefly, these show that:
- Fatal accidents to employees fell fairly steadily over the decade, by around one-third overall.
- All accidents to employees rose in the first half of the decade and then fell, showing little change overall.
- Working days lost from accidents and prescribed diseases rose by around one-fifth in the first half of the decade but then showed little change.
- International comparisons show GB comparing well with other countries.
1.2.4 It seems fair to say, then, that the changes proposed in the Robens Report were not motivated by a dramatic recent worsening in the data, or unfavourable comparisons with other countries. In the absence of any such findings from the data, the Report simply asserts that “whatever qualifications or reservations may be attached to the statistics, common prudence requires us to consider very seriously whether we may not have reached some sort of plateau in occupational safety and health performance” (para 17). (David Ashton’s essay Why Robens? analyses the actual reasons underlying the establishment of the Committee of Inquiry and the recommendations made in the Report[4]).
1.3 Development of GB health and safety statistics since Robens
1.3.1 As mentioned above, the Report describes various problems with the statistics which were then available (paras 406-415). In addition, from a modern perspective it is striking how little attention was paid to health as opposed to safety (just one paragraph is devoted to “Industrial disease statistics”) – even though the passage on the newly established Employment Medical Advisory Service had been farsighted in observing that EMAS’s remit should include “the study of broad problems such as mental health in industry and sickness absence” (para 374). There have been many advances in Britain’s official health and safety statistics since the early 1970s, and it is worth saying something about these before proceeding to analyse them – indeed, it is not going too far to say that without these advances there would not be much to analyse.
1.3.2 The Robens Report made two specific recommendations concerning statistics (para 412):
- “Priority should be given to the task of devising a standard form of accident report suitable for the purposes of both the Department of Health and Social Security and the proposed Authority for Safety and Health at Work …”
- “There should be a small but professional statistical unit within the proposed Authority for Safety and Health at Work …”.
1.3.3 A common report form, so that employers would need to report an accident only once to the health and safety regulator and the social services department was briefly introduced but quickly dropped. This policy was replaced by the Notification of Accidents and Dangerous Occurrences Regulations (NADOR) 1980[5] and then the Reporting of Injuries Diseases and Dangerous Occurrences Regulations (RIDDOR) 1985, amended in 1995, 2012 and 2013. These regulations provide for all employers to use a common report form irrespective of which sector they worked in. Under RIDDOR, a ‘responsible person’ is required to notify the enforcing authority where a person dies or sustains any injuries or specific medical conditions or where a dangerous occurrence takes place in connection with a work activity. (The Regulations and schedules set out the specific injuries, dangerous occurrences and diseases which were reportable).
1.3.4 The recommendation to establish a statistical unit was also fulfilled early in the life of HSE. An “Economics and Statistics Unit” was set up by the early 1980s, alongside NADOR, while a separate “Medical Statistics and Surveys Unit” was already in existence by the late 1970s in support of the recently established EMAS. Both units were based in HSE’S London office and moved to the new Bootle HQ in the mid-1980s. This separation between statistics on safety and on health continued, surprisingly, for many years; the two units co-operated on projects such as the annual Health and Safety Statistics[6] , but “Safety and Enforcement Statistics” and the “Epidemiology and Medical Statistics Unit” were only brought together in the same Directorate, and finally merged into a single Statistics Branch, in the mid-2000s.
1.3.5 Reflecting this organisational split, developments in the statistical sources post-Robens proceeded separately for safety and for health[7]. On the safety side, RIDDOR has continued to be a leading source for both fatal and non-fatal injuries; as an administrative data source it has advantages in terms of cost and richness of data at individual record level, but suffers from under-reporting (apart from fatalities) as well as discontinuities due to changes in the reporting legislation and operational arrangements (e.g. the move from over-3-day to over-7-day injuries in 2012, and from major to specified injuries in 2013) [8]. Because of this, HSE has commissioned questions about self-reported workplace injuries on the Labour Force Survey (LFS). The LFS is a household survey run by the Office for National Statistics (ONS); it gives a comprehensive picture of self-reported workplace injuries by a range of demographic and job-related factors, and a consistent time-series (since 2000/01).
1.3.6 For work-related ill health there is a more complex story and a wider range of sources. Data on reportable diseases under RIDDOR were always very limited and are no longer published by HSE. The Industrial Injuries Disablement Benefit (IIDB) scheme is also longstanding, but is limited to diseases which can be clearly attributed to occupation. Death Certificates provide another long time series, on mortality from occupational lung diseases, especially those related to asbestos exposure. The Health and Occupation Reporting network (THOR and THOR-GP) comprises voluntary surveillance schemes, partly funded by HSE since the 1990s, under which specialist doctors and General Practitioners (respectively) report all new cases that they see in their clinics. As with injuries, the most broadly based estimates come from the Labour Force Survey; HSE has commissioned questions about self-reported work-related illness periodically since 1990. Unlike with injuries, prior to this there was no source on the overall scale of work-related ill health and so the results were truly ground-breaking – especially for musculoskeletal disorders and stress, which they revealed to be by far the largest categories.
1.3.7 The LFS also provides data on working days lost, due to both ill health and injuries, and is a key input into HSE’s estimates of the costs to Britain of workplace injuries and new cases of work-related ill health, produced annually by HSE economists and statisticians[9]: these cover all injuries (fatal and non-fatal) and cases of ill health (self-reported), which are added together using valuations of the costs they impose, both financial and ‘human’. Unfortunately, the Costs to Britain estimates are only available on a consistent basis back to 2004/05.
1.4 Questions to be addressed by this analysis
1.4.1 With this background, it is possible to set out how this paper will answer the questions outlined at the start.
1.4.2 First, what has happened to occupational health and safety outcomes in Great Britain in the past 50 years? This is addressed in three parts. Section 2.1 considers which health and safety outcomes to include in the analysis, bearing in mind the coverage and comparability of the various statistical sources on injuries and ill health. Section 2.2 describes the published National Statistics in these areas, available on the HSE website. And Section 2.3 arrives at a statistical assessment of the change over time, over the whole 50 years or available sub-periods, in each of the injury and ill health measures.
1.4.3 The next question is how these changes compare with what would have happened anyway, in the absence of Robens/HSWA/HSE. Short of conducting a retrospective experiment it is not really possible to come up with such a counterfactual, but the paper attempts two approximations. First, Section 2.4 compares the post-1970s experience with what happened immediately prior to Robens, as presented in 1.2.3 above. And next, Section 3 asks how do the changes in GB compare with other countries’ experience? Section 3.1 looks at the availability of data on health and safety at work in different countries. Section 3.2 focuses on the comparable statistics on levels of health and safety outcomes, principally in the European Union, while Section 3.3 looks at comparisons of changes over time.
1.4.4 The other key consideration is how much of the changes in GB health and safety outcomes can be attributed to broader economic and social factors, rather than the occupational health and safety policies followed since the Robens report, the Health and Safety at Work Act and the foundation of HSE. Sections 4.1 and 4.2 deal with two key economic factors – changes in industrial/occupational structure and the economic cycle – while Section 4.3 considers the effects of wider social conditions and policies.
1.4.5 On the basis of this analysis, it is possible to draw some conclusions as to what can be said about the impact on health and safety outcomes of Robens/HSWA/HSE. Section 5.1 sets out the approach to arriving at such judgements, while 5.2, 5.3 and 5.4 present these for workplace injuries, work-related ill health and working days lost respectively.
1.4.6 And finally, in writing this paper a number of questions have arisen which could not be answered in the present analysis. Sections 6.1-6.5 lists these remaining questions, with an indication of how they might be pursued in further stages of the overall Project.
2 What has happened to health and safety outcomes in Great Britain in the past 50 years?
2.1 Which health and safety outcomes to cover
2.1.1 As is clear from the above historical account, a number of different statistical sources are available for GB, giving data on a range of health and safety outcomes over a variety of periods. To make the subsequent analysis manageable and informative, it will be necessary to narrow these down to a fairly small number of indicators which have reasonably comprehensive coverage of the harm caused at work, in terms of injuries and ill health, and are comparable over time, either for the whole 50 years or for sizeable sub-periods.
2.1.2 It is worth considering first whether a single measure can be identified which encompasses all health and safety harms. Tempting as it is to focus on fatal injuries, which have the longest time series and are least subject to under-reporting, to do so would omit the harm caused by non-fatal injuries and by all kinds of work-related ill health. HSE’s estimates of the costs to Britain of work-related injuries and ill health could provide a good summary measure, but are very limited in terms of the time series and international comparisons available. Therefore the following analysis will feature a range of indicators covering different health and safety outcomes. Given the object of the exercise, which is to examine the impact of Robens/HSWA/HSE on outcomes, it will deliberately exclude ‘long-latency’ health outcomes such as asbestos-related cancers, where the disease can take decades to develop and so such impact would take too long to be discerned. For example, deaths from mesothelioma increased steadily since the early 1970s (to around 2,500 per year), reflecting historic asbestos exposures, but are now showing signs of falling.[10]
2.1.3 Turning to specific kinds of harm, HSE statisticians have identified preferred data sources[11] for various categories of injuries and ill health. Most of these are not available for the whole 50-year period which is of interest for the present analysis, reflecting the fact that new sources have been developed over time, but many of them do provide some data for the majority of the period. A further consideration is that to be comparable over time (and between countries), the injury and ill health estimates should be expressed relative to the population at risk, normally as rates per 100,000 employees or workers. This is especially important when making long-term comparisons: ONS data[12] show that between 1971 and 2021, for example, the number of people in employment increased by some 30 per cent.
2.1.4 Based on all of this, the following seven health and safety outcomes will be analysed using indicators from the data sources stated (acronyms explained in paras 1.3.5-6 above). Between them, these indicators will provide a fairly comprehensive picture of how GB health and safety outcomes compare over recent decades.
Health and safety outcomes and data sources to be covered by the analysis
- Fatal workplace injuries: RIDDOR back to 1986/87, together with reports under earlier Regulations back to 1974, adjusted to a consistent coverage.
- Non-fatal workplace injuries: LFS back to 2000/01, supported by RIDDOR back to 1986/87.
- Work-related ill health: LFS back to 2001/02, with limited data for England and Wales back to 1990. For overall ill health, and also separately for the two largest components:
- Musculoskeletal disorders (MSDs) and
- Stress, depression or anxiety.
- Breathing or lung problems: LFS back to 2001/02, supported by data from THOR on occupational asthma back to 1999.
- Working days lost: LFS back to 2000/01 for injuries, 2001/02 for ill health.
2.2 Published National Statistics
2.2.1 Data on all these indicators are collected, collated and published by HSE statisticians who are members of the Government Statistical Service. The data have ‘National Statistics’ status, meaning that they meet standards of trustworthiness, quality and public value assessed by the independent Office for Statistics Regulation (OSR)[13]. Even if it were feasible to seek out alternative sources of data on health and safety outcomes over the last five decades, it would make no sense to try to ‘re-invent the wheel’ in this way, and so the present analysis will be founded on the published statistics.
2.2.2 Specifically, this Section of the analysis will make extensive use of the ‘historical picture’ page on HSE’s website[14]. In a couple of areas it will be necessary to go further than the published data: to help estimate rates of fatal injuries back to 1974 using ONS employee data[15] (rates per 100,000 employees are only published back to 1981); and to combine the estimates of non-fatal injuries from the LFS with earlier data from RIDDOR so as to provide an integrated picture back to 1986/87 (consistent LFS estimates are only available back to 2000/01). The analysis will use an endpoint of 2019/20, in line with HSE statisticians’ advice that because of the coronavirus pandemic “it is not possible to make meaningful statistical assessments of trend across the most recent years”[16].
2.3 Statistical assessment of change over time in each outcome
2.3.1 For each of the outcomes identified above, an estimate will be given of the overall percentage change in the indicator over the period for which data are available, going back as close as possible to 1974 (the earliest date given in the ‘historical picture’). To minimise the risk of the comparison being distorted by a single year’s figures – especially important since the data are mostly either based on relatively small numbers (RIDDOR fatalities) or derived from a sample survey (LFS) – this will use a three-year average for each start/endpoint[17]. The comparison will also be expressed as an annual average percentage change[18], a key metric for comparisons between different indicators (and, in Section 3 below, between different countries) for which different periods’ data are available. Finally, if the statistics suggest that there have been one or more changes of trend for the indicator over the course of the period, these will be noted.
2.3.2 Fatal workplace injuries:
- The rate of fatal workplace injuries has fallen by 88% over the period 1974 to 2019/20, or by an average of 4.8% per year.
- The fatal injury rate fluctuates from year to year, reflecting natural statistical variation and special circumstances[19]. In addition there is evidence of a change of trend around 2009/10, since when it has been broadly flat rather than falling. Between 1974 and 2009/10 the fatal injury rate fell faster than during the overall period, with the average fall being 5.2% per year.

2.3.3 Non-fatal workplace injuries
- For non-fatal injuries, no single source covers the entire period of interest. The Labour Force Survey is HSE statisticians’ preferred source, but LFS data are only available for 2000/01 to 2019/20; from 1986/87 to 2000/01, information on non-fatal injuries (with over 3 days absence) is only available from RIDDOR.
- These two percentage changes can be spliced together to give an estimated fall of 72% between 1986/87 and 2019/20, or 4.0% per year. Between 2000/01 and 2011/12, when both series are available, the LFS measure fell much faster than RIDDOR; therefore applying the RIDDOR rate of decline prior to 2000/01, as done here, gives conservative estimates of the fall over the whole period.
- Non-fatal injuries fell faster between 1986/87 and 2009/10 (when the average annual rate of fall was 4.3%) than over the whole period.

2.3.4 Work-related ill health
- The rate of work-related ill health (self-reported) has fallen by 28% over the period 1990 to 2019/20[20], or by an average of 1.2% per year.
- There is evidence of a change of trend around 2010/11, since when the rate has been broadly flat rather than falling. Between 1990 and 2009/10 the rate of work-related ill health fell faster than during the overall period, with the average fall being 2.3% per year.

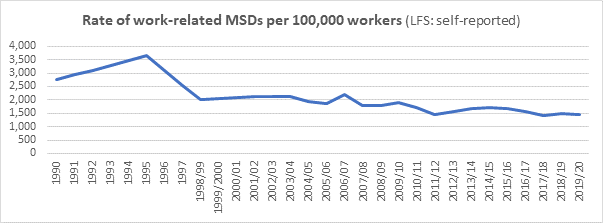
2.3.5 Work-related musculoskeletal disorders (MSDs)
- The rate of work-related MSDs (self-reported) has fallen by 50% over the period 1990 to 2019/20, or by an average of 2.6% per year.
- The rate of work-related MSDs fell by an average of 2.7% per year between 1990 and 2009/10, slightly faster than over the whole period.
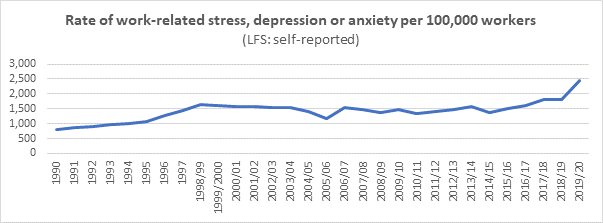
2.3.6 Work-related stress, depression or anxiety
- The rate of work-related stress, depression or anxiety (self-reported) has risen by 131% over the period 1990 to 2019/20, an average rise of 3.2% per year.
- There is evidence of changes of trend around 1998/99 and 2015/16; between these dates it was broadly flat while before and afterwards it has been rising. The average rate of increase between 1990 and 2009/10 was 2.6%,
2.3.7 Breathing or lung problems
- The rate of work-related breathing or lung problems (self-reported) has fallen by 28% over the period 2001/02 to 2019/20, or by an average of 2.1% per year.
- There is evidence of a change of trend around 2010/11, since when the rate has been broadly constant or rising. Indeed, the average annual rate of fall between 2001/02 and 2009/10 was 7%, much higher than that for the whole period. Analysis of longer-term trends in occupational asthma by the THOR team[21] shows a decline since 1999 but a rise since 2014.

2.3.8 Working days lost
- The number of working days lost per worker due to work-related injuries and ill health has fallen by 27% over the period 2000/02 to 2019/20, or by an average of 1.9% per year.
- There is evidence of a change of trend around 2010/11, since when the rate has been broadly flat rather than falling. The rate fell by an average of 5% per year between 2000/02 and 2009/10.

2.4 Comparison with a counterfactual
2.4.1 Examination of the available data has shown, then, that the rate of health and safety outcomes in GB, on various measures of injuries and ill health and over a variety of periods, has shown annual falls ranging from 4-5% per year for non-fatal and fatal injuries, to 2-3% per year for musculoskeletal disorders and breathing/lung problems, and 1-2% per year for working days lost and total work-related ill health. The rate of work-related stress, depression or anxiety, on the other hand, showed an annual increase of 3% per year.
2.4.2 In order for these numbers to contribute to an assessment of the performance of the GB health and safety system (post-Robens/HSWA/HSE), they need to be compared with some sort of counterfactual, in terms of what might have happened to outcomes in the absence of such a system. The most obvious counterfactual is provided by looking at trends in outcomes immediately prior to the 1970s changes. Unfortunately, it has been seen that the official statistics available prior to the 1970s, as published in the Robens report, were very limited – only produced for fatal and non-fatal injuries and for working days lost, only for the years 1961-70, and on a very different basis to the indicators listed in 2.1.4 above[22].
2.4.3 Nonetheless, it is possible to calculate annual percentage changes in the indicators shown in Section 1.2.3 and compare them with those for the later period(s), as follows:
|
Pre-Robens (1961-70) |
Post-Robens |
|
|---|---|---|---|
Rate of fatal injuries |
-3.5% |
(1974 to 2019/20) |
-4.8% |
Rate of non-fatal injuries |
+1.2% |
(1986/87 to 2019/20) |
-4.0% |
Working days lost per worker |
+2.3% |
(1990 to 2019/20) |
-1.9% |
Bearing in mind the caveats, then, the statistics suggest that the post-1974 rates of improvement compare with a somewhat smaller fall observed in the 1960s for fatal injuries, and with small rises for non-fatal injuries and for working days lost. However, because of the data limitations and differences between the periods this is not conclusive, and so the next Section examines what more can be learned from the alternative possible counterfactual: comparing the experience of GB with those of other countries.
3 How does this compare with other countries’ experience?
3.1 Data availability and comparability
3.1.1 International comparisons are notoriously difficult in the field of occupational health and safety statistics, for reasons summarised in a recent International Labour Organisation (ILO) publication[23]:
- “In addition to the variety of possible sources, many other factors contribute to hindering the international comparability of occupational safety and health statistics. These factors include (but are not limited to) differences across countries in the legal framework governing occupational safety and health, social protection systems, health insurance systems, the composition of the labour market …”
These difficulties are even greater when making comparisons going far back in time, as is the aim here, since improvements have been made over the years in the coverage and comparability of many countries’ health and safety statistics. In using these statistics for the purpose of comparing GB outcomes with a counterfactual, the assumption is made that none of the other countries had a regime the same as brought in by Robens, but no attempt has been made to analyse the details of the regimes that did operate in those countries.
3.1.2 As far as establishing a counterfactual is concerned, both levels and changes are relevant. The percentage change over time in an indicator, expressed as an annual average, shows the rate of improvement in a country; it can be argued that these will be comparable even the levels are not. And when comparing GB’s health and safety outcomes with other countries, the latest estimate of the level of each indicator is also important – provided these are broadly internationally comparable – as it shows the end result regardless of the path followed. The remainder of this Section will look separately at comparisons of levels and of changes: for levels it will use published internationally comparable sources, while for changes over time it will make bespoke calculations to derive figures for other countries which can be compared with the GB estimates quoted in paras 2.3.2–8 above
3.1.3 Three main sources have been used for this exercise (Annex 1 gives more details):
- International Labour Organisation “ILOSTAT” database: estimates of the rate of fatal and non-fatal occupational injuries, both level and percentage change; going back to the 1970s for some countries but limited to more recent years for most.
- European Union “Eurostat” database: data on the rates of fatal and non-fatal injuries at work, standardised to allow for the differing industrial structure of employment between member states; and separately, estimates from the EU-wide Labour Force Survey of the proportion of workers who had taken sick leave as a result of a workplace injury, or of a work-related ill health problem.
- United States Bureau of Labor Statistics (BLS): a special article giving data on fatal and non-fatal injuries back to 1992 and 1972 respectively.
3.2 International comparisons of levels
3.2.1 The HSE statistics website includes a page presenting all the latest available comparisons with other European countries[24], taken from the Eurostat source, which will form the basis of this part of the analysis (and from which the three charts are extracted). They include estimates for UK as they relate to years when it was still a member of the EU; these internationally comparable data will differ from the GB data in the rest of this paper.
3.2.2 Fatal workplace injuries:
- The UK consistently has one of the lowest rates of fatal injury in Europe. In 2018 the standardised rate was 0.61 per 100,000 employees, around half the EU28 average (1.17). Compared to other large economies[25], the rate was similar to Germany (0.55) and lower than France (3.07), Spain (1.49), Italy (1.04) and Poland (1.03).
Standardised incidence rates of fatal injury at work, excluding road traffic accidents and accidents on board transport in the course of work (Eurostat, ESAW, 2018)

3.2.3 Non-fatal workplace injuries
- EU Labour Force Survey data show that in 2013, 1.4% of UK workers reported taking time off due to a work-related injury. This compared with other large economies as follows: France (3.1%), Italy (1.8%), Spain (1.8%) and Poland (0.7%)[26].
Percentage of workers who had an injury resulting in sick leave over the last 12 months (Eurostat, EU LFS, 2013)
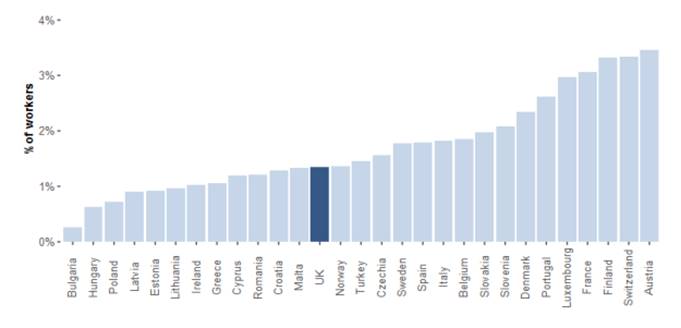
3.2.4 Work-related ill health
- EU Labour Force Survey data for 2013 show that 1.9% of UK workers reported taking time off work due to one or more work-related health problems. This is around half the EU28 average (3.7%) and lower than most other large economies, as follows: Poland (7.7%), France (5.4%), Germany (3.8%), Spain (2.8%) and Italy (1.9%).
Percentage of workers with one or more work-related ill health problems resulting in sick leave (Eurostat, EU LFS, 2013)

3.2.5 In summary, the latest internationally comparable data on levels of health and safety outcomes, which relate mainly to EU nations, show the UK performing better than other large countries on the available measures for fatal injuries (standardised), work-related ill health and to a lesser extent non-fatal injuries.
3.3 International comparisons of changes over time
3.3.1 The ILOSTAT database contains data on the rates of fatal and non-fatal injuries in over 100 nations and territories from all over the world, from Argentina to Zimbabwe. It is extremely variable in terms of the number of years for which data are available and their comparability over time: often the source and/or coverage of a country’s statistics changes between the start of the time series and the end, sometimes more than once.
3.3.2 To reduce the number of comparisons to a manageable level, and also to make them more meaningful, the following selection criteria have been applied:
- Only looking at countries which are large, industrialised economies, defined here as members of the G7 (USA, Canada, Japan, France, Germany, Italy as well as the UK), other large EU countries (Spain, Poland).
- Only analysing the data where there is a reasonably long and (as far as can be established) consistent time series, defined as at least 25 years from start to end point. This is considered separately for fatal and for non-fatal injuries[27].
In each case, as was done for the GB data in paras 2.3.2-8 above, both the total percentage change and the annual average (as a compound rate) are calculated:
3.3.3 Fatal workplace injuries (rate per 100,000 workers) (3-year averages):
|
Period for which data are available |
Number of years |
Total percentage change |
Annual average percentage change |
|---|---|---|---|---|
Great Britain |
1974 to 2019/20 |
45 |
-88% |
-4.8% |
USA |
1992 to 2018 |
26 |
-24% |
-1.1% |
Canada |
1985 to 2018 |
33 |
-77% |
-4.6% |
Japan |
1979 to 2020 |
41 |
-82% |
-4.2% |
France |
1974 to 2015 |
41 |
-84% |
-4.4% |
Germany |
1990 to 2015 |
25 |
-82% |
-7.2% |
Poland |
1975 to 2015 |
40 |
-84% |
-4.7% |
Spain |
1980 to 2019 |
39 |
-81% |
-4.5% |
3.3.4 Non-fatal workplace injuries (rate per 100,000 workers) (3-year averages):
|
Period for which data are available |
Number of years |
Total percentage change |
Annual average percentage change |
|---|---|---|---|---|
Great Britain |
1986/87 to 2019/20 |
33 |
-72% |
-4.0% |
USA |
1972 to 2018 |
46 |
-74% |
-3.0% |
France |
1990 to 2015 |
25 |
-43% |
-2.4% |
Germany |
1990 to 2015 |
25 |
-65% |
-4.4% |
Spain |
1983 to 2019 |
36 |
-50% |
-2.0% |
3.3.5 In summary, for the limited number of large, industrialised countries for which a reasonably long consistent time series is available (just seven for fatal and four for non-fatal injuries), most have seen impressive percentage reductions in workplace injury outcomes over recent decades. The GB rate of improvement is similar to most of these other countries for fatal injuries, and somewhat faster than most of them for non-fatal injuries.
4 How much of the changes can be attributed to broader economic and social factors?
4.1 Industrial/occupational structure
4.1.1 It does not need a detailed statistical analysis to observe that the British economic landscape in the early 2020s is vastly different from 50 (or even 30) years earlier. Employment in the primary and secondary sectors (especially mining and manufacturing respectively) has continued a long-term decline while that in services (especially professional and technical) has grown. Equally, it is clear that a worker’s risk of injury or illness varies greatly with the job they are doing, and that the declining industries have been, broadly speaking, those with higher risks of injury (and some illness, e.g. lung disease): to quote an extreme example, the data quoted in the Robens report show that in the late 1960s around 150 workers were dying every year in mining and quarrying, which is roughly the same as the total annual death toll in GB in the late 2010s.
4.1.2 The question to be addressed in this section is how much of the changes in health and safety outcomes described earlier can be attributed to changes in the structure of the economy – in terms of both industry (type of economic activity) and occupation (the actual jobs people were doing). The analysis will draw heavily on HSE-commissioned research from the Warwick Institute for Employment Research (IER)[28], published in 2005. This concluded that (quoting from the Executive Summary):
- “The dominant influence that contributes to an individual’s risk of injury is their occupation.”
- “Analysis of RIDDOR data indicates that the rate of over-3-day injury and major injuries have declined by approximately a third between 1986 and 2003.”
- “Based on changes in occupational structure, analysis reveals that we would have expected these rates to have declined by approximately 20 per cent.”
In other words, a good part of the fall (some 60%) in the rate of non-fatal injury between 1986 and 2003 was due to the changing occupational structure of the GB workforce. The remaining 40% reduction are therefore down to other factors, including improvements in health and safety standards.
4.1.3 The IER study was a very substantial piece of work, and it will not be feasible to update it here to anything like the same standard. However, three relevant questions which can be tackled are:
- To what extent are its conclusions, based on analysis of data from 1986 to 2003, likely to be valid for the longer period under consideration here?
- Would the effects of industrial/occupational changes in GB also apply (and to what extent) in the other countries which have been used above as counterfactuals?
- Can anything be said about the impact of industrial/occupational changes on ill health outcomes (the IER research only looked at injuries)?
The next three paragraphs attempt to address these questions, albeit in a crude way limited by resource and availability of the data. In particular, they look only at industrial structure (at a very broad level), as an imperfect proxy for occupation which was the focus of the IER work. For these purposes, it is relevant that the industries with the highest rates of fatal and non-fatal injuries have been in the primary and secondary sectors, especially agriculture and construction, while those with the lowest have been in the tertiary sector, especially professional/scientific/technical services[29].
4.1.4 A long time-series of data on the structure of UK employment by industry is available in a recent ONS publication[30], based on detailed work for the Bank of England’s “Millennium of Macroeconomic Data” project[31]. Using this it is possible to analyse how the industrial breakdown of employment has changed over time: between 1986 and 2003, the period analysed in the IER research, and for the longer period examined here. In summary:
- Over the whole period since 1974 the share of the primary sector fell from 3.4% to 1.3%. This equates to 0.05 percentage points per year, somewhat slower than the rate of change observed over the 1986-2003 period analysed in the IER research, 0.08 percentage points per year.
- Since 1974 the share of the secondary sector fell from 35.8% to 15.1%, or by 0.49 percentage points per year (within this, the share of manufacturing fell from 26.9% to 7.6%, and construction[32] only from 7.4% to 6.5%). This was the same as the annual change observed between 1986 and 2003 (0.49 points per year).
- Since 1974 the share of the tertiary sector rose from 60.8% to 83.6%, or by 0.54 percentage points per year. This was roughly the same as the annual change seen between 1986 and 2003 (0.57 points per year).
In summary, then, there is evidence that the 1986-2003 period analysed by IER was broadly representative of the longer period in terms of industrial shifts in employment, although with a somewhat faster decline in the primary sector, and so its findings can be expected to apply to this period too.
4.1.5 For other countries, the data source is the Organisation for Economic Co-operation and Development OECD.Stat Database[33]. This provides long time series for most of the countries analysed in Section 3 above, but unfortunately not for all of them and only at the level of very broad sector: primary/secondary (combined) and tertiary. It allows analysis of the extent to which the sectoral changes observed in GB – at this high level – were mirrored in other large industrial countries with which comparisons have been made. In summary:
- Over the whole period since 1974 (the starting point of the fatal injuries comparisons in 3.3.3 above), the share of primary/secondary sector employment in GB fell from 39.2% to 16.4%, or by 0.54 percentage points per year. This compared with annual average falls of 0.35 percentage points in Canada, 0.41 in the USA, 0.54 in Japan and 0.67 in Germany.
- Over the shorter period since 1986/87 (starting point of the non-fatal injuries comparisons in para 3.3.4), the share of primary/secondary sector employment in GB fell from 29.3% to 16.4%, or by 0.44 percentage points per year. This compared with annual average falls of 0.28 percentage points in Canada, 0.30 in the USA, 0.51 in Japan and 0.65 in Germany.
It can therefore be seen that, in terms of very broad industrial structure, the large shifts observed in GB over the last few decades have been fairly typical of the limited number of other large industrialised countries for which data are available. In other words, to the extent that such shifts explain some of the improvements in injury rates in GB, the limited evidence suggests that the same is true in other countries too, and that the favourable international comparisons above cannot be put down to structural shifts in the economy.
4.1.6 All of the above applies to injury outcomes, which were the subject of the IER research. There is no such rigorous evidence base for the effects of occupational/industrial shifts on work-related ill health; however, it is well-established that the higher-risk industries are very different for ill health than for injuries, being concentrated (overall and for MSDs and stress) in the service sector, especially human health and social work, public administration/defence and education. Therefore the long-term changes in the structure of employment observed in GB and other developed countries – specifically, the growth in the service sector – might be expected to have raised rates of work-related ill health.
4.2 The economic cycle
4.2.1 Alongside its conclusions on the impact of occupational change on trends in injury rates, the IER research contained significant findings on the effects of the economic cycle[34]:
- “Analysis reveals that the rates of major injury follow a pro-cyclical pattern over the course of the business cycle. This pro-cyclical pattern appears to be related to changes in the incidence of new hires.”
In other words, periods of growth tend to put upward pressure on injury rates and recessions to reduce them. While this is important for understanding short-term movements in injury rates, especially in manufacturing and construction, it is of less relevance to the longer-term trends being analysed here. Moreover, the use of three-year averages to calculate changes over time will soften any effects of the economic cycle on health and safety outcomes[35].
4.3 Broader social conditions and policies
4.3.1 Beyond the long-term and short-term economic factors just discussed, there is a wide range of potential broader influences on occupational health and safety outcomes, beyond those attributable to the regulatory regime introduced by the Robens report, the passing of the Health and Safety at Work Act and the creation of HSE. These include but are not limited to:
- Developments in healthcare capability: for example, any improvements in the quality of emergency medical care after accidents could reduce the average severity of workplace injuries.
- Changes in the prevalence of non-work causes of ill health: many health conditions are multifactorial – for example some MSDs might be related to poor posture both at work and at home – and the different factors may interact.
- Awareness of and attitudes to reporting different health and safety outcomes: for example, awareness of work-related stress has changed over time, with it more likely to reported (and self-reported) now than in the past.
- Changing public attitudes to health and safety: influenced by political actors and the media, the public profile and legitimacy of ‘health and safety’ have evolved over time[36].
- Shifts in the nature of industrial relations: the relative power held by employers, employees and trade unions has changed greatly since the 1970s[37], with a dramatic decline in union membership[38].
- Changes in social conditions: broader conditions such as the level of deprivation and inequality are known to interact with occupational factors, as has been seen with respect to the impact of COVID-19 on different social groups[39].
- Policies in areas other than occupational health and safety: health and safety policies do not operate in a vacuum, and Government decisions for example on the level and distribution of public spending may also have an important influence on health and safety outcomes.
4.3.2 In this context it is interesting to note that in the statistical assessment of change over time trends in Section 2.3 above, five of the seven indicators showed a change of trend – slowing the rate of improvement – around 2010 (or in one case 2015). This is a helpful reminder that, even against a background of long-term improvements following the regime brought in by Robens/HSWA/HSE, health and safety outcomes may also be responsive to shorter-term social and political developments.
5 What can be said about the impact of Robens/HSW/HSE?
5.1 Approach to overall judgement
5.1.1 It is widely recognised that measurement of health and safety outcomes is complex and challenging, and attributing changes in outcomes to particular causes even more so. For example, the International Association of Labour Inspection (IALI) handbook on measuring performance[40] states that:
- “Measurement of improvement in the OSH situation is more complex [than in other areas] due to a number of factors:
- It is difficult to define what to measure
- Potential costs of the performance management process
- It is complex to determine attribution of OSH results to a labour inspectorate
- It is not easy to acquire or access appropriate data
- There is a time lag between intervention and results.”
While in a recent analysis as part of a major study of regulatory delivery[41], the authors note:
- “Overall, while measuring outcomes is the most relevant way to evaluate enforcement effectiveness, the complexity of the causal chains means that this can never be a simple exercise and requires the consideration of trends (and changes in trends), comparisons across different jurisdictions, and external factors at play.”
5.1.2 There are analogies here to the challenges presented by measuring progress against numerical targets set in the Revitalising Health and Safety strategy in 1999. In response to those challenges, HSE statisticians developed an approach which involved reaching a judgement on the direction and size of the changes in outcomes over the period, based on the available statistical sources and relevant supporting research, and published a progress report each year[42].
5.1.3 Using a similar approach, which involves expert assessment as well as the available quantitative data, the next three sections bring together the evidence presented above on injuries (fatal and non-fatal), ill health (overall, MSDs, stress and breathing/lung problems), and working days lost due to both, to arrive at judgements on the impact on health and safety outcomes of Robens/HSWA/HSE.
5.2 Safety outcomes
5.2.1 Fatal injuries showed an annual average rate of improvement since 1974 of 4.8% per year. This was a little faster than the improvement seen in the decade immediately prior to Robens, and similar to those seen in other major industrialised countries. Britain’s fatal injury rate, standardised for industrial structure, is around half the EU28 average
5.2.2 For non-fatal injuries the annual average rate of improvement, estimated conservatively at 4.0% per year since 1986/87, is higher than in the pre-Robens period and than observed in other countries. The GB non-fatal injury rate, from the EU-wide Labour Force Survey, is lower than most other major countries for which data are available.
5.2.3 The evidence suggests that structural changes in the economy (towards the service sector) played a part in these improvements; however, the available evidence suggests that similar changes were happening in other major economies.
5.2.4 The overall judgement, therefore, is that the substantial improvements in workplace safety outcomes can be attributed in part to the regime brought in by Robens/HSWA/HSE, especially for non-fatal injuries. This is based on a range of evidence but particularly on comparisons with other countries which did not have such a regime.
5.3 Health outcomes
5.3.1 Work-related ill health declined by 1.2% per year since 1990, based on self-reports from the Labour Force Survey. No comparisons are available with the pre-Robens period, or with changes over time in other countries, but the GB rate of work-related ill health from the EU-wide LFS is around half the EU28 average.
5.3.2 Within this, work-related musculoskeletal disorders showed an annual fall of 2.6% (since 1990) and breathing/lung problems an annual fall of 2.1% (since 2001/02), while stress, depression or anxiety saw an annual rise of 3.2% (since 1990). No comparisons with the pre-Robens period or with other countries are available for these outcomes.
5.3.3 It is likely that the relatively slow improvements, and in some cases deterioration, will partly reflect the same structural changes in the economy (as the service sector is higher risk for most health outcomes). They may also reflect increasing levels of awareness and (self-)reporting, especially of work-related stress.
5.3.4 Because of the limited scope for comparisons with a counterfactual, as well as the relatively short time series, it is not possible to arrive at an overall judgement on the impact of Robens/HSWA/HSE on work-related health outcomes. However, it is worth noting that the rate of improvement (or deterioration) in these outcomes has varied considerably over the period, suggesting a potential role for wider socio-political factors.
5.4 Health and safety outcomes
5.4.1 Working days lost per worker due to both injuries and ill health showed an annual average rate of improvement of 1.9% per year since 2001/12. This appears to compare favourably with the immediate pre-Robens period, but no international comparisons are available.
5.4.2 Therefore, as with work-related ill health, it is not possible to arrive at an overall judgement on the impact of Robens/HSWA/HSE on working days lost.
5.4.3 In fact ill health (rather than injuries) accounts for the bulk of working days lost[43], as it does for the estimated costs to Britain of workplace injuries and work-related ill health[44]. The relative paucity of evidence on work-related ill health, and therefore on the aggregate of health and safety outcomes, is something that will be returned to in the final Section, on questions still to be addressed.
6 Remaining questions
In the course of putting together this paper, a number of questions have arisen which could not be answered within current resources and timescales but which it may be possible to consider at later stages of the overall “50th Anniversaries” Project. These are listed below, together with suggestions as to how they might be addressed.
6.1 Data on the management of health and safety
6.1.1 Although not collected over as long a time period as the final outcome statistics analysed in this paper, some data are available on exposure to risks and on awareness, attitudes and behaviours regarding health and safety. These might help to fill the gap mentioned in Section 5.3 above, in providing more evidence to support a judgement on the impact of Robens/HSWA/HSE on health outcomes.
6.1.2 Some of the data come from international sources such as the European Working Conditions Survey (EWCS)[45] and, in particular, the European Survey of Enterprises on New and Emerging Risks (ESENER)[46]. Like the Labour Force Survey, these are based on self-reports, and hence use information from those who know best about safety and health in the workplace; they have been run on a number of occasions, and so some analysis of trends should be possible, although mostly for more recent years (and to some extent limited by the fact that the UK is no longer a member of the EU).
6.2 Case studies of outcomes in specific contexts
6.2.1 The analysis in this paper has necessarily been at the level of the overall picture, but it may be possible to provide more depth by focusing on particular areas and incorporating subject matter expertise as well as data analysis. For example, evaluations of past HSE strategies, programmes and campaigns (such as Revitalising Health and Safety (RHS), Securing Health Together (SH2) and Fit for Work, Fit for Life, Fit for Tomorrow (Fit3)) may provide useful information, as may Post Implementation Reviews (PIRs) of particular pieces of legislation (e.g. the Control of Asbestos Regulations).
6.2.2 A particular candidate for such a case study is the construction sector. As noted in para 4.1.4 above, construction’s share of total employment has been relatively constant over the decades. The sector has long been a priority for HSE, which has a great deal of specialist expertise concerning it, and much information is already published about its performance in terms of health and safety outcomes[47].
6.3 Analysis of the costs and benefits of the post-Robens regime
6.3.1 The present analysis has focused on the benefits of the health and safety regime; further work might look at costs too, and the balance between the two. This could draw on past work on overall economic costs and benefits, to business and to society, as well as impact assessments / post-implementation reviews of specific interventions.
6.4 Extension of the analysis to cover the regime for Major Hazards
6.4.1 As well as ‘conventional’ health and safety, part of the post-Robens regime relates to the avoidance of low-frequency, high-impact catastrophic incidents, resulting for example from explosive and flammable substances. Here the need is for data not on outcomes but on ‘precursor’ events, for example hydrocarbon leaks in the offshore oil industry.
6.5 Statistical basis for future analysis of the impact of the health and safety regime
6.5.1 This paper has pointed to a number of areas where limitations with the available data have constrained the conclusions which can be drawn. For the future, the position will be much eased by the improvements which have made over the years in maintaining and developing statistical sources, as described in Section 1.3. In addition it may be worth considering what more can be done to provide a secure basis for this sort of analysis, in part by reviewing past initiatives for the development of the statistical infrastructure.
Annex: Sources for international data
Three main sources have been used for the international comparisons in Section 3:
1. International Labour Organisation “ILOSTAT” database, topic “safety and health at work”[48]: Provides estimates of the rate of fatal and non-fatal occupational injuries per 100,000 workers, i.e. corresponding to the first two indicators listed in Section 2.1.4. The data provide estimates of both level and percentage change, going back to the 1970s for some countries but limited to more recent years for most.
2. European Union “Eurostat” database, theme “health and safety at work”[49]:
a. European Statistics on Accidents at Work (ESAW): Like the ILO source, gives data on the rates of fatal and non-fatal injuries at work, in this case excluding road traffic accidents (and accidents on board of any means of transport in the course of work) to ensure comparability with the GB data. Importantly, the Eurostat incidence rates are standardised to allow for the differing industrial structure of employment between member states (and some non-EU states). Unfortunately, these estimates are only available on a consistent basis back to 2008[50] and so are only useful for providing estimates of levels.
b. European Labour Force Survey (EU LFS): Provides estimates of the proportion of workers who had taken sick leave as a result of a workplace injury, or of a work-related ill health problem, i.e. corresponding to the second and third indicators listed in para 2.1.4. These come from modules of questions included in the EU LFS in 2007, 2013 and (excluding the UK) 2020; they give the most comparable data on work-related non-fatal injuries and ill health across the EU (and some non-EU states), although some apparent differences between countries may reflect differing levels of (self-)reporting. Again, this source provides estimates of levels rather than changes over time.
3. United States Bureau of Labor Statistics (BLS) “Nearly 50 years of occupational safety and health data”[51]: A special article produced to mark the US’s own 50th anniversary, of their 1970 Occupational Safety and Health Act, which gives data on fatal and non-fatal injuries back to 1992 and 1972 respectively[52].
Other than the US source – which fortuitously covers very similar ground to the present exercise for GB – no attempt has been made to access individual countries’ data sources.
Footnotes
[1] Special thanks to Maria Ottati (former HSE Chief Economist) and Suzi Curtis for their input.
[3] The data are subject to various limitations. The GB figures relate only to employees and exclude those (around 20 per cent of the workforce) who were not in scope of any health and safety legislation. The international comparisons relate to different years and only cover manufacturing.
[4] Employment Secretary Barbara Castle observed in March 1970 that “the old approach to these problems is inadequate … we ought to be asking some far-reaching questions about our safety legislation”; and the Robens Report highlighted the “tangle of jurisdictions” (para 33) and stated that “a thoroughgoing overhaul is needed” (para 40).
[5] Prior to NADOR, reporting was required under various legislation, chiefly the 1961 Factories Act.
[6] Available online back to 1999/2000 https://www.hse.gov.uk/statistics/publications/general.htm
[7] A detailed description of HSE’s statistical data sources, with links for more information, is available at https://www.hse.gov.uk/statistics/sources.pdf
[8] https://www.hse.gov.uk/statistics/riddor-notification.htm
[9] Published at https://www.hse.gov.uk/statistics/cost.htm
[10] HSE Mesothelioma statistics for Great Britain, 2021 ![]()
[11] Published at https://www.hse.gov.uk/statistics/preferred-data-sources.pdf
[12] Number of People in Employment (aged 16 and over, seasonally adjusted)
[13] Details are given at https://www.hse.gov.uk/statistics/about/index.htm
[14] Published at https://www.hse.gov.uk/statistics/history/historical-picture.pdf
[15] JOBS01: Workforce jobs summary
[16] HSE has published a detailed analysis of the impact of the coronavirus pandemic on the interpretation of health and safety statistics: https://webarchive.nationalarchives.gov.uk/ukgwa/20221119122610/https://www.hse.gov.uk/statistics/coronavirus/covid-19.pdf
[17] For example, for fatal injuries the comparison will be between the averages for 2017/18-2019/20 and 1974-76.
[18] The average will be expressed as a compound annual rate: for example, the average percentage by which the fatal injury rate would have needed to fall in each of the 45 years from 1974 to arrive at the value observed in 2019/20; this is not the same as simply dividing the total percentage fall by 45 (essentially for the same reason as compound interest works differently to simple interest, except that in this case the ‘interest’ accumulated each year is negative).
[19] For example, the Piper Alpha disaster in 1988 and the Covid pandemic in 2020/21.
[20] LFS estimates for work-related ill health, MSDs and stress relate to England and Wales for 1990, 1995 and 1997/98 and to GB thereafter; however the rates are broadly comparable for the entire period.
[21] Time trends in the incidence of contact dermatitis and asthma in the UK, 1996-2019: estimation from THOR surveillance data. Iskandar I, Carder M, Barradas A, Byrne L, Gittins M, Seed M, van Tongeren M (2020). Available at https://www.hse.gov.uk/statistics/pdf/thortrends20.pdf
[22] The pre-1970 data were given as absolute numbers rather than rates per 100,000, although in fact this has little effect as ONS data show that total employee numbers changed little during the 1960s: JOBS01: Workforce jobs summary
[23] “Quick Guide on sources and uses of statistics on occupational safety and health”, published at https://ilo.org/wcmsp5/groups/public/---dgreports/---stat/documents/publication/wcms_759401.pdf
[24] Published at https://www.hse.gov.uk/statistics/european/european-comparisons.pdf. These comparisons use the rates for GB as published by Eurostat (e.g. the fatal injury rates are standardised); they also generally show data for the UK rather than GB, but this makes very little difference.
[25] The fatal injuries data for smaller countries can fluctuate from year to year.
[26] Due to methodological issues no data on non-fatal injuries are available for Germany, the Netherlands or the EU average.
[27] This criterion results in Italy being excluded from both sets of comparisons and Canada, Japan and Poland from the analysis of non-fatal injuries.
[28] “Trends and context to rates of workplace injury”, HSE Research Report 386, available online at https://www.hse.gov.uk/research/rrpdf/rr386.pdf
[29] Latest UK data available at https://www.hse.gov.uk/statistics/industry/index.htm
[30] The difference between the picture for UK and GB can be ignored for current purposes. Available at Long-term trends in UK employment: 1861 to 2018
[31] Available at https://www.bankofengland.co.uk/statistics/research-datasets. The endpoint in the ONS/Bank of England data is 2016.
[32] As a relatively stable sector, construction is an interesting potential subject for a future case study; see Section 6 below.
[33] Available at https://stats.oecd.org/index.aspx?queryid=38899, short-term labour market statistics on employment by sector.
[34] This part of the IER analysis has been updated, and broadly confirmed, by HSE at https://www.hse.gov.uk/statistics/adhoc-analysis/economic-cycle-paper.htm?pdf=economic-cycle-paper
[35] The five recessions in Britain since the mid-1970s – in 1974/75, 1980/81, 1990/91, 2008/09 and 2020/21 – each lasted on average a little over a year.
[36] See The changing legitimacy of health and safety at work, 1960–2015, Paul Almond and Mike Esbester, Institute of Occupational Safety and Health (IOSH), available at https://iosh.com/media/3422/the-changing-legitimacy-of-health-and-safety-at-work19602015.pdf
[37] See Health and safety regulation – reflections on four decades, Phil James, Health and Safety Bulletin, July 2021
[38] Latest statistics are at https://www.gov.uk/government/statistics/trade-union-statistics-2020
[39] See COVID-19 and occupation: position paper 48, Industrial Injuries Advisory Committee (IIAC), March 2021
[40] Measuring Performance in the Occupational Safety and Health Function ![]() , Helle Tosini and Nils-Petter Wedege, IALI, p 21
, Helle Tosini and Nils-Petter Wedege, IALI, p 21
[41] “The Impact of Inspections, Measuring Outcomes from Occupational Safety and Health Inspections”; Florentin Blanc and Giuliana Cola; in Regulatory Delivery, ed Graham Russell and Christopher Hodges, Bloomsbury 2019, p 240.
[42] The targets were to reduce fatal and major injuries, work-related ill health and working days lost by 10%, 20% and 30% respectively, by the year 2010. The Revitalising strategy statement and the 2009 progress report are no longer on the HSE website but are available at https://www.ilo.org/global/topics/safety-and-health-at-work/resources-library/publications/WCMS_212130/lang--en/index.htm
[43] Around four-fifths according to the latest data; see https://www.hse.gov.uk/statistics/dayslost.htm
[44] Around two-thirds according to the latest data; see https://www.hse.gov.uk/statistics/cost.htm
[45] More detail is at https://www.eurofound.europa.eu/surveys/european-working-conditions-surveys-ewcs
[46] More detail is at https://osha.europa.eu/en/facts-and-figures/esener. HSE statisticians’ analysis of 2014 ESENER data for the UK is available at https://www.hse.gov.uk/statistics/oshman.htm.
[47] HSE statisticians publish an annual update on construction statistics from various sources. See https://www.hse.gov.uk/statistics/industry/construction.pdf
[48] Available at https://ilostat.ilo.org/topics/safety-and-health-at-work/
[49] Available at https://ec.europa.eu/eurostat/data/database?node_code=hsw_mi03
[50] Some data are available back to 1998 but there appears to be a major discontinuity in 2008; also estimates for the EU as a whole are not available before that year.
[51] Available at https://www.bls.gov/opub/btn/volume-9/nearly-50-years-of-occupational-safety-and-health-data.htm
[52] For the USA, the ILO database is preferred for fatal injuries as it shows rates per 100,000 while the national source cited above only gives numbers of injuries. For non-fatal injuries the national source is preferred as it gives a much longer time series (and does give rates per 100,000).